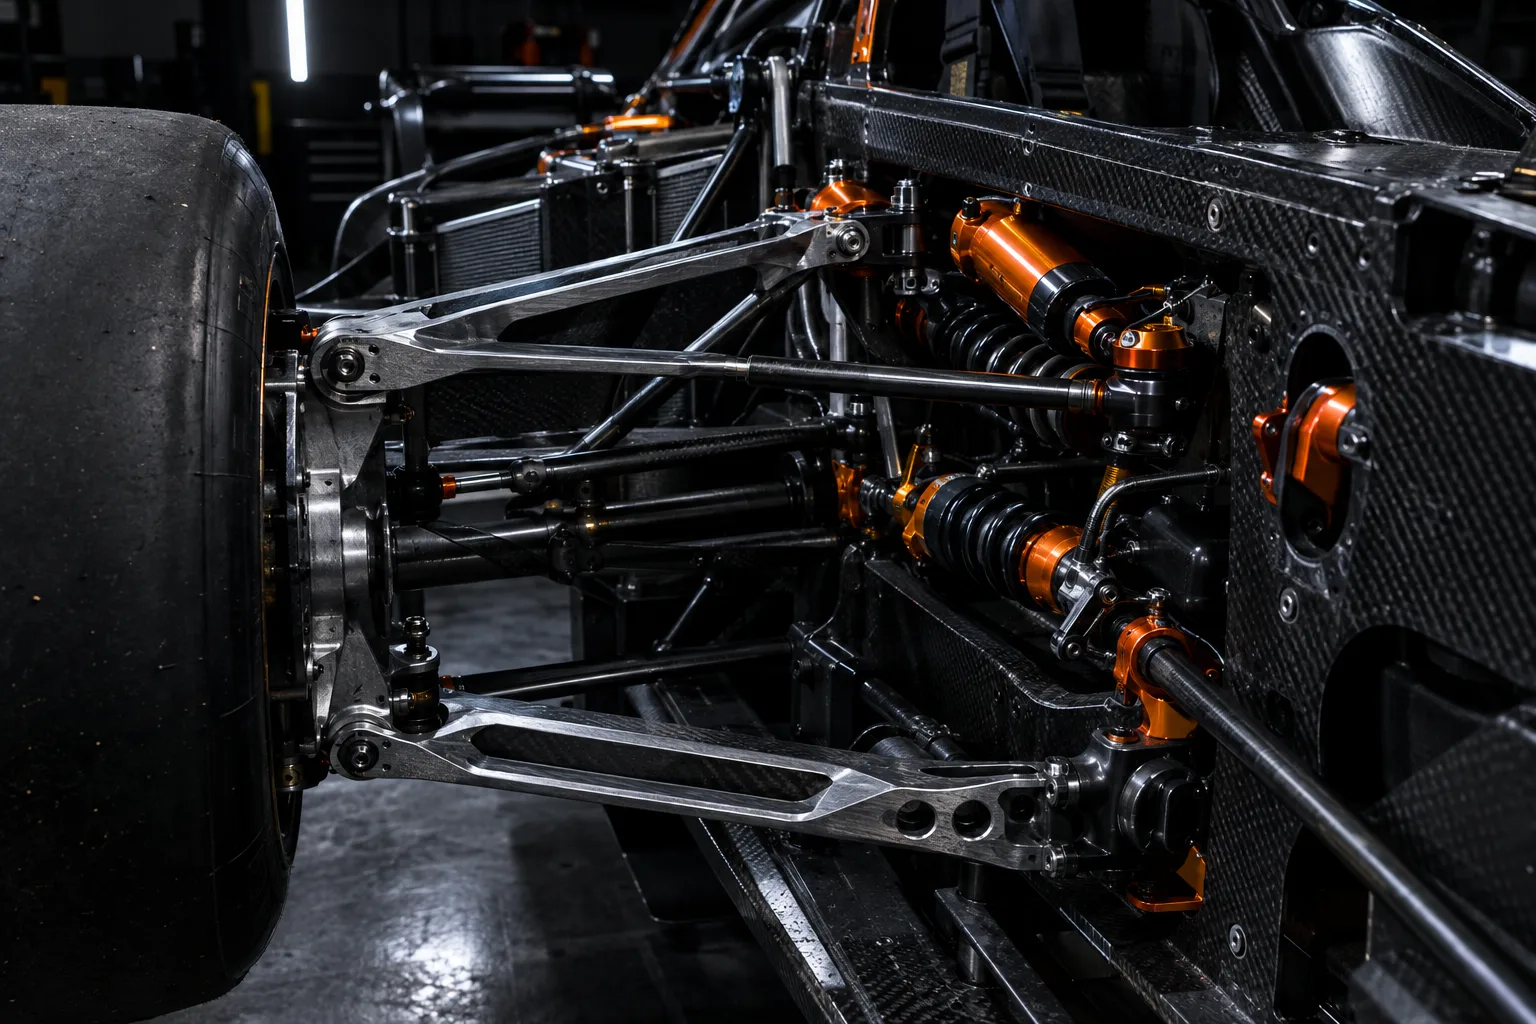
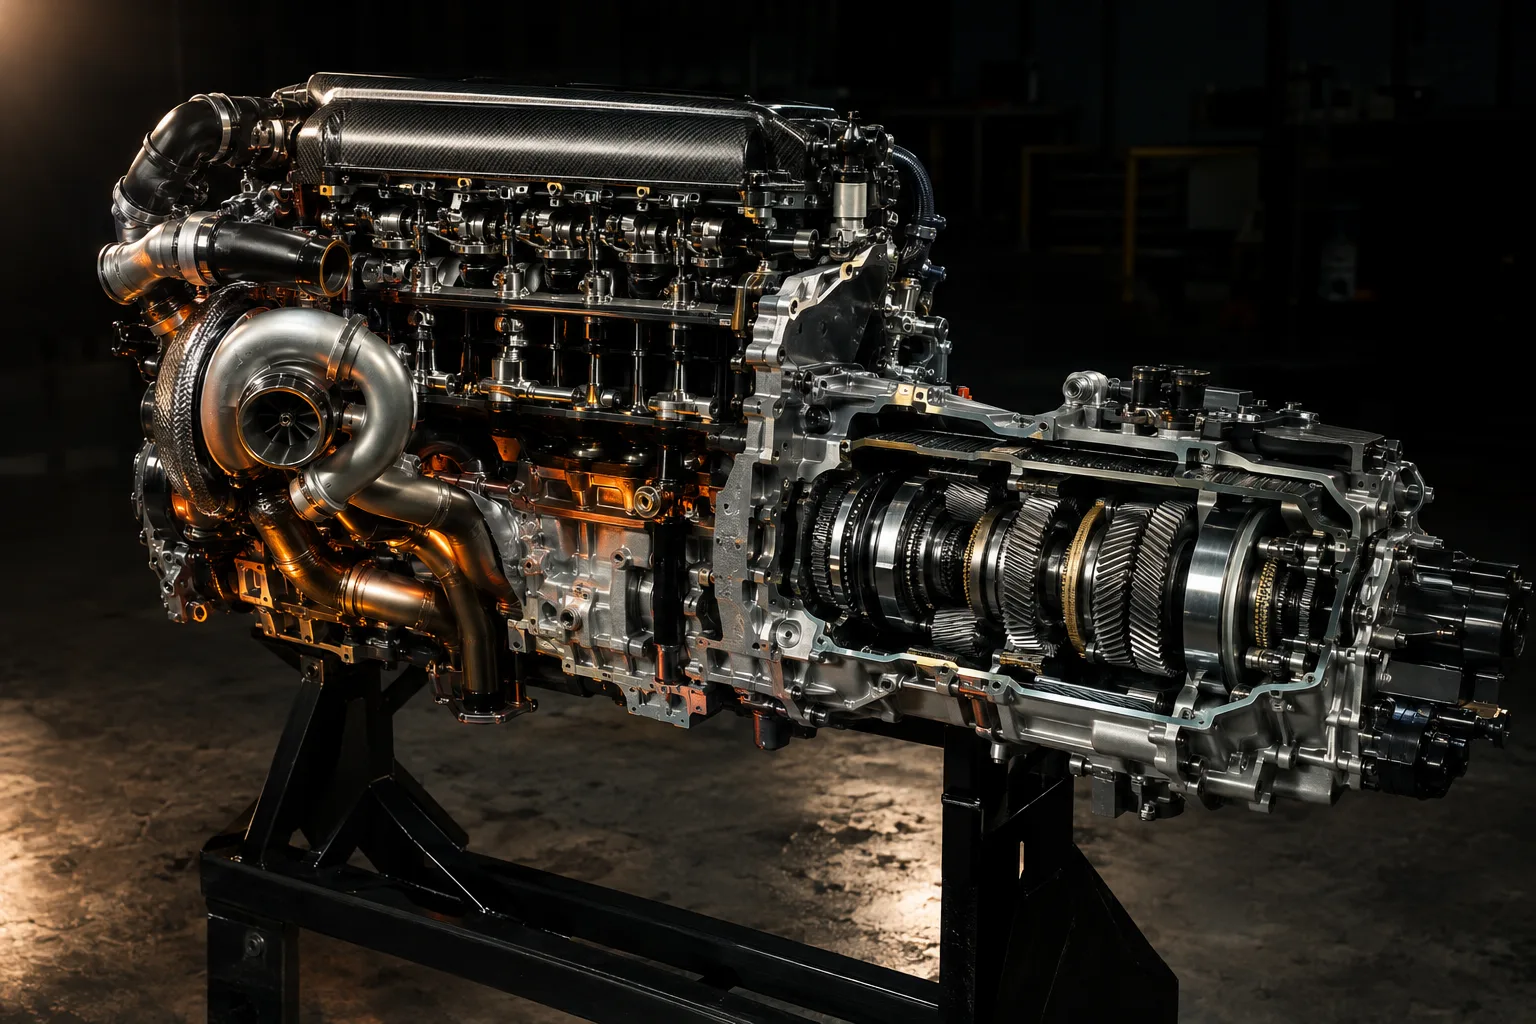
R&W Labs / Lab 01: X-Ray
Under the skin.
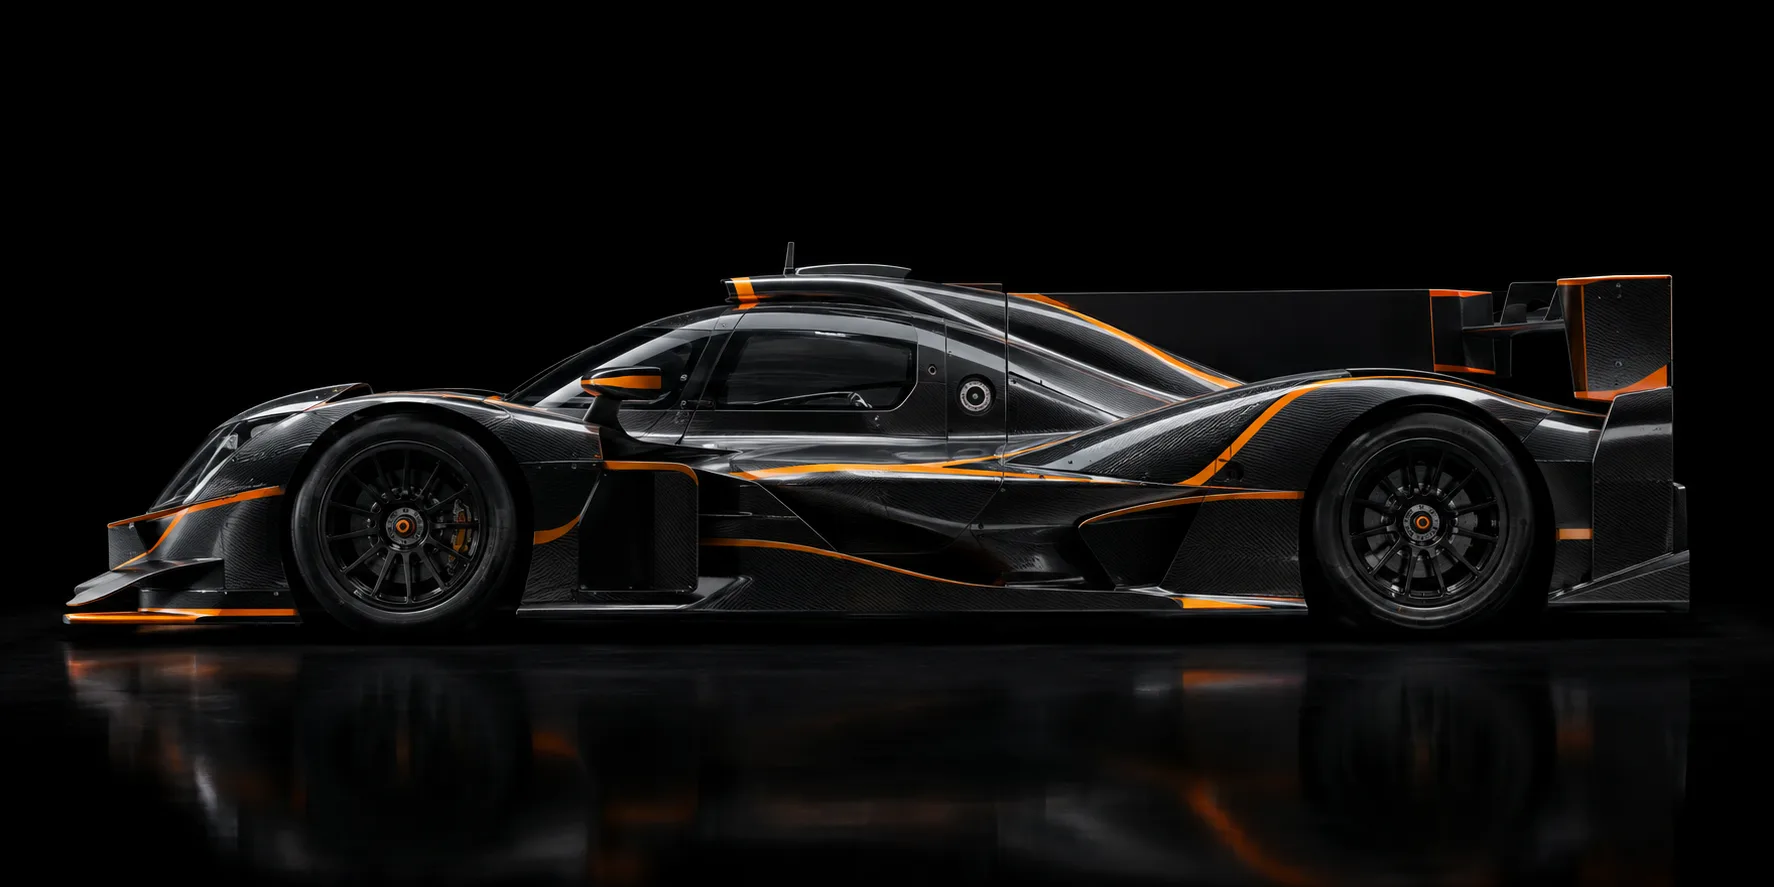
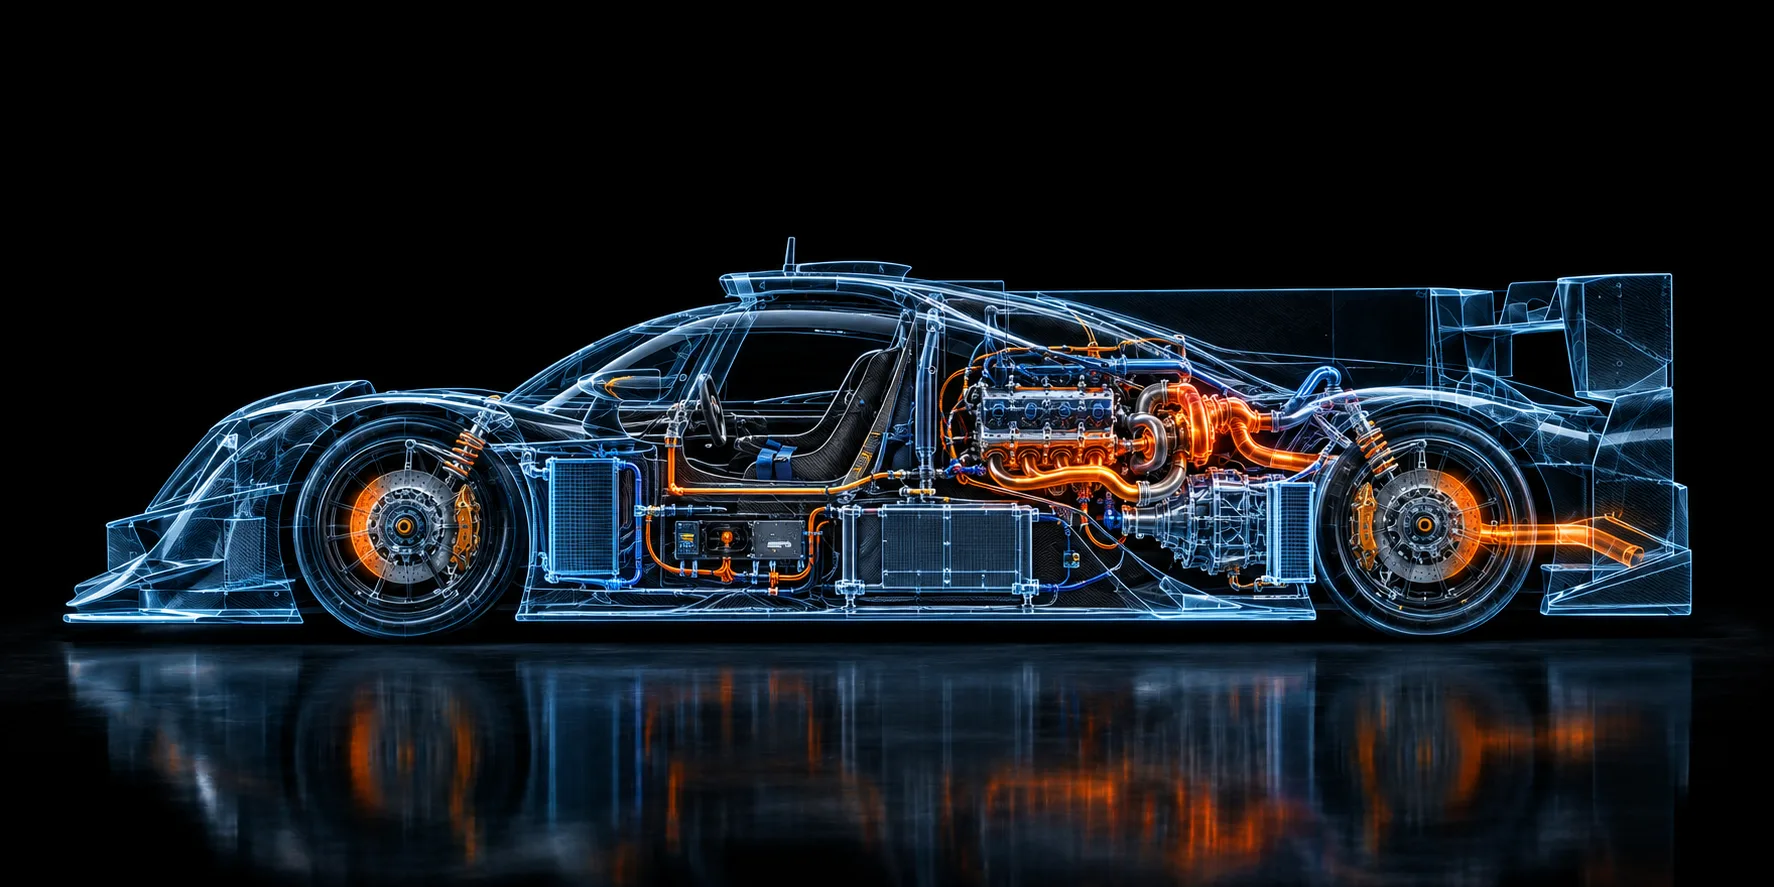
Race car engineering, aero and technology, explained by taking the car apart. Move over the car to see what's inside.
The Labs
Each lab is one idea you can play with. Move a slider, watch the physics respond.
Lab 02 / Aero
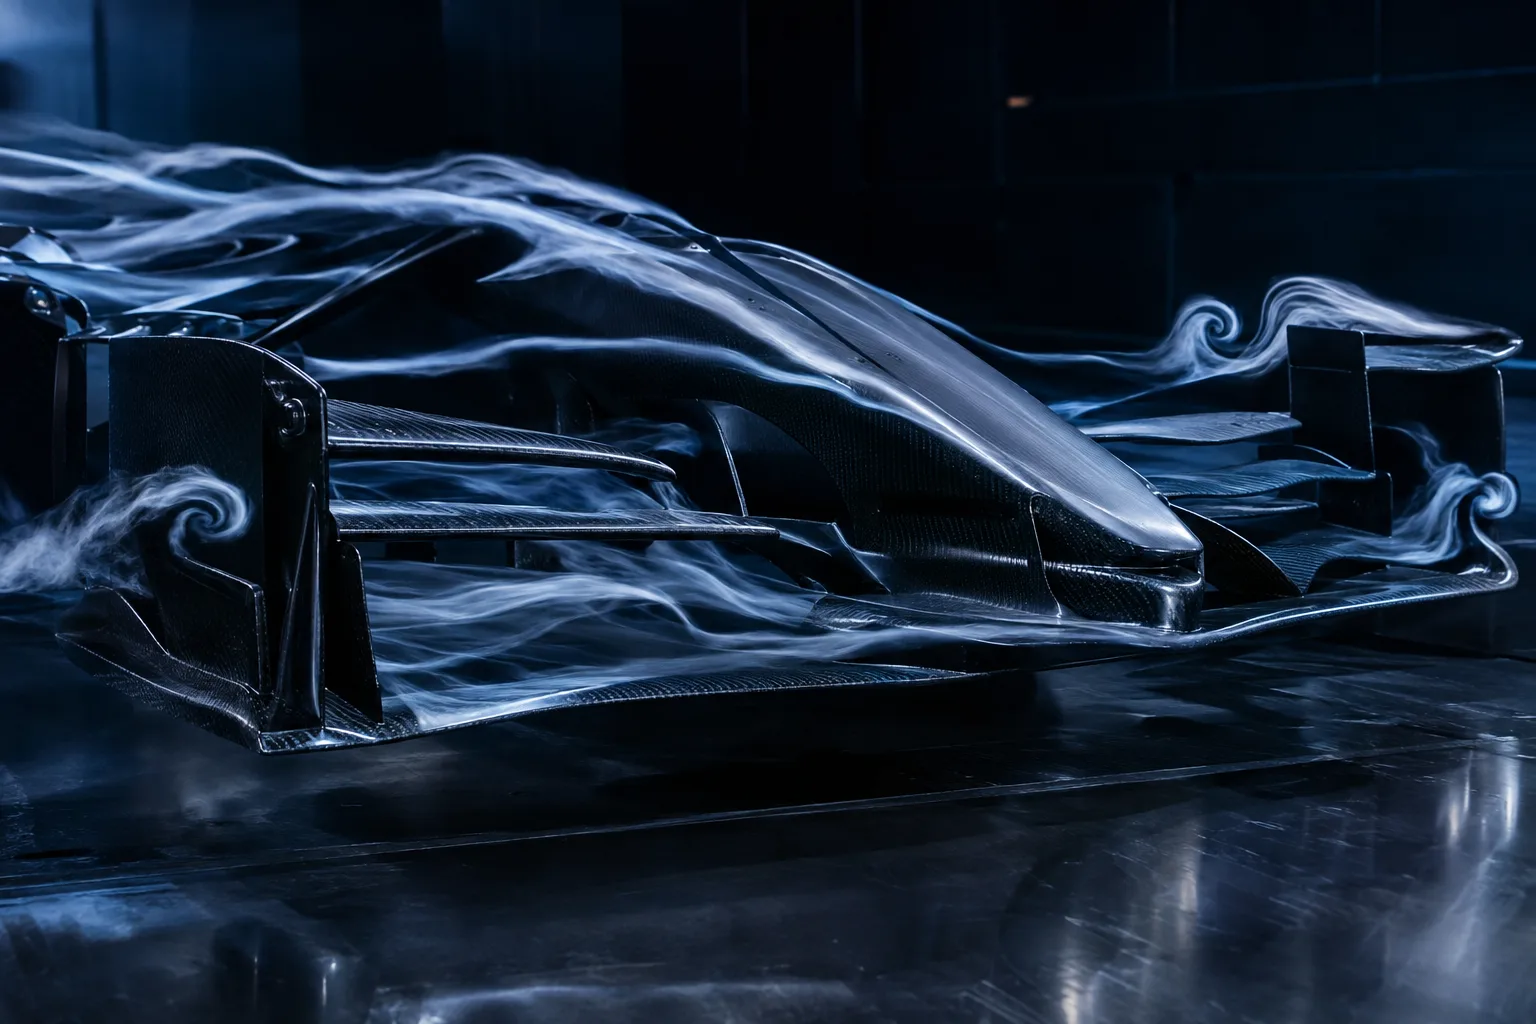
Downforce grows with the square of speed.
Double the speed and the wings push down four times harder. Past a certain speed, the car makes more downforce than it weighs. That's why "it could drive upside down" gets said so often.
Move either slider. Watch the orange curve and dot respond.
- Downforce · equiv. load
- —
- Drag
- —
- Power lost to drag
- —
- Upside-down speed
- —
F = ½ · ρ · v² · CLA · simplified model, 1,030 car
Click any underlined unit to switch the whole site. Downforce is shown as an equivalent load; drag is force.
Lab 03 / Brakes
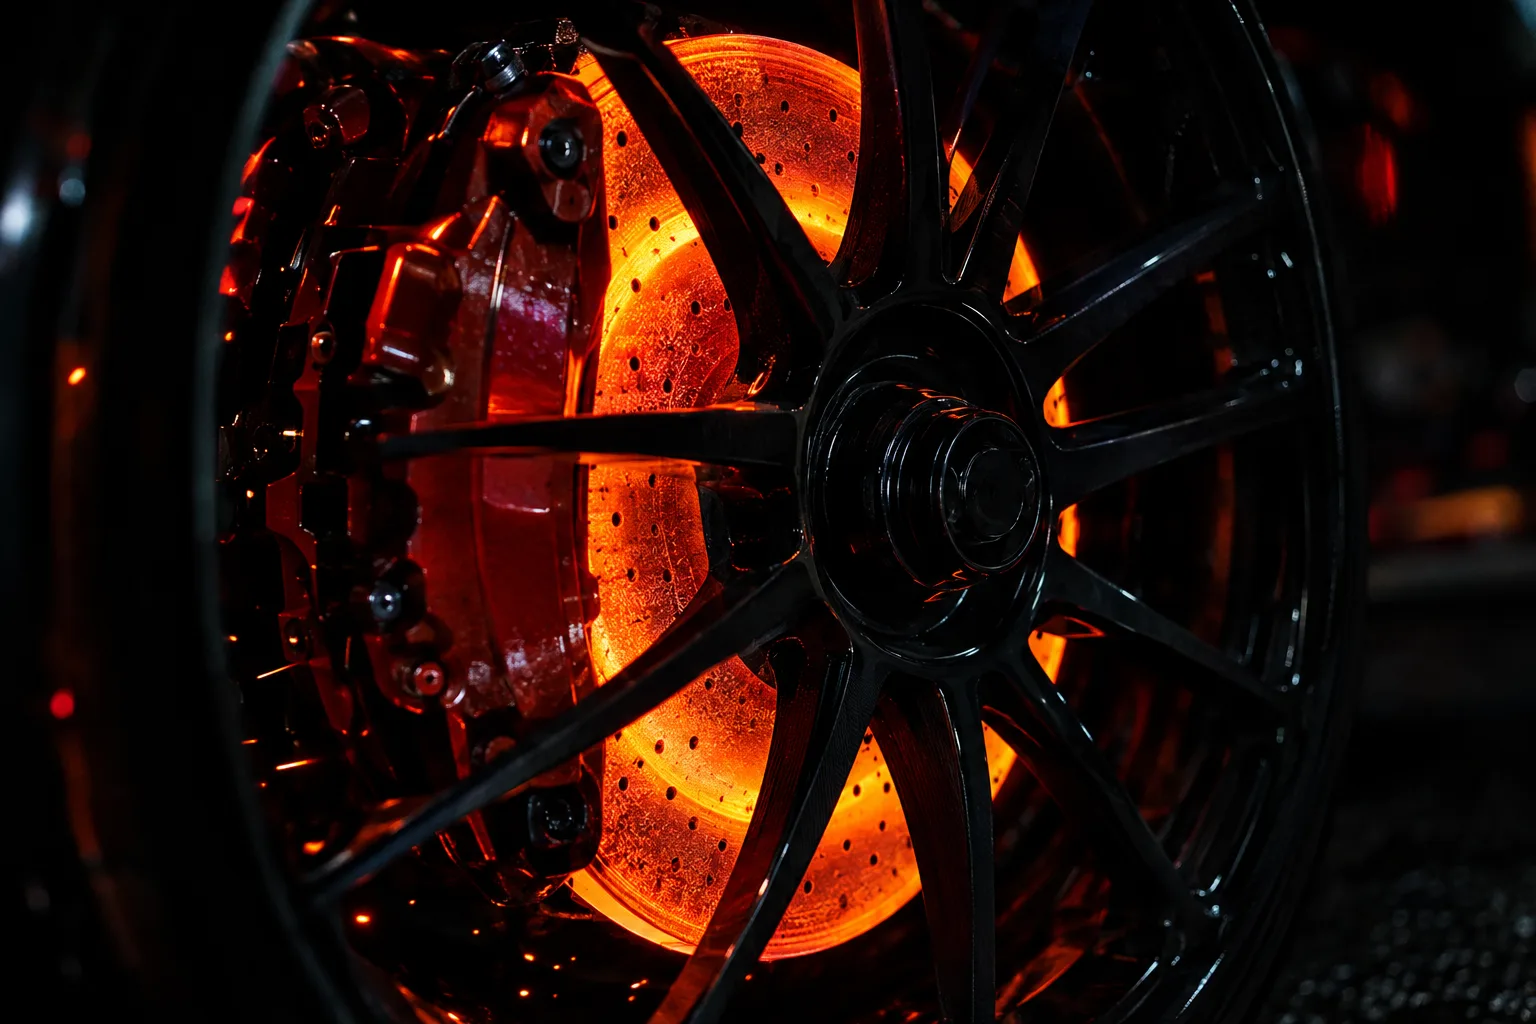
Carbon brakes only work hot.
Carbon-carbon discs have a temperature window. Cold, they barely grip. In the window, they bite hard. Too hot, the carbon starts to oxidise and wears away fast. Teams tune the brake ducts to keep them in range.
- Grip (friction μ)
- —
- Wear rate
- —
- State
- —
Illustrative curve. Real values vary by compound and supplier.
Lab 04 / Data
How to read a lap trace.
This is a simulated lap, drawn the way a race engineer sees it. Switch to the raw bus view to see the same lap as the messages the car's computers send each other.
Raw CAN bytes keep their original encoding in either display setting.
- Orange block: braking zone. The driver hits the brake hard, then eases off while turning in.
- Blue dip: the corner. The lowest point is the minimum speed, usually at the apex.
- Green climb: throttle pickup. The earlier and smoother it rises, the faster the exit.
In the workshop